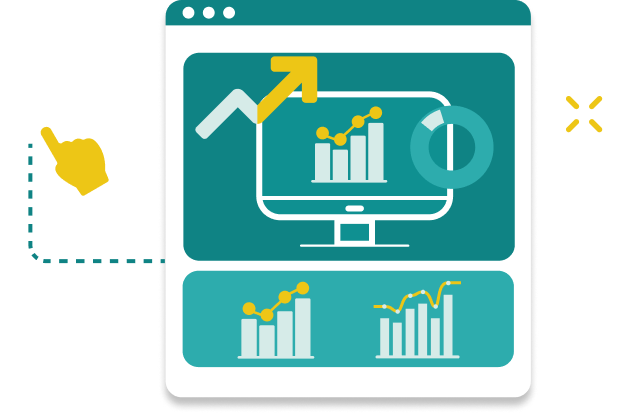
Seeing a sudden spike in bounces? With a single click, the system pinpoints the root cause. Analyze interactive data directly in the dashboard—no need for IT to generate complex reports.

Monitor key mailbox providers and react before issues arise. Recipient domains generating the highest sending volume are automatically identified and grouped.
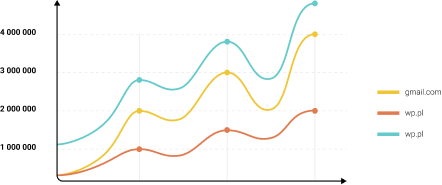
Track delivery performance for selected business partners and customers. Manually monitor any chosen domain, regardless of sending volume.
Compare the health of different brands and message types. Analyze the performance of various From: addresses or subdomains within a single account.
Understand why messages fail to reach recipients through a clear classification of delivery errors. Bounces are automatically categorized as Hard bounce, Soft bounce, or Spam bounce.
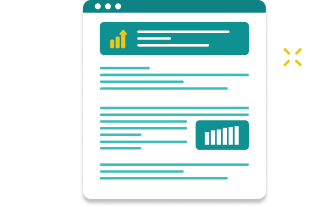
The analytics dashboard acts as your early warning system, but resolving issues effectively often requires drilling down to the level of individual events.

Deliverability issues are frequently reported with a delay. At EmailLabs, log retention periods depend on the selected plan and can be extended when needed. Contact us to choose a solution tailored to the specifics of your business.

When analytics highlight an anomaly (such as a spike in bounces for a specific domain), you can immediately move to log-level analysis. Filter by status, email address, or Message-ID to pinpoint the exact messages that contributed to the negative trend.

We don’t obscure the technical reasons behind rejections. You get full visibility into the exact feedback returned by receiving servers (e.g. 5.7.1 or 4.4.2 codes) – without masking or flattening them into generic labels. This gives your IT team precise insight into whether an issue stems from DNS configuration errors, message content, or a recipient mailbox being full.
Hundreds of e-commerce companies and financial institutions rely on EmailLabs to ensure business continuity.
We guarantee compliance with GDPR, NIS2, and DORA, supported by ISO 27001, 22301, and 27018 certifications. Our infrastructure is hosted exclusively in certified data centers within the EEA – without using providers outside the EU.
Your data is encrypted, and our systems are monitored 24/7. If questions arise, our local Support Team is ready to help you interpret every chart and resolve deliverability issues.
No. Email API Analytics requires no changes to your application code or additional integration. The module works based on the data you are already sending via our API or SMTP servers. Once our Team activates the service, the reports will automatically appear in your web app.
Analytics processes data in real-time, starting from the moment the service is launched. This means charts and tables will only be populated with new events (sends, opens, statuses) from the time of activation and will not include retrospective data.
These are two different views of your database. The Mail Providers Report automatically highlights the TOP 10 providers (e.g., Gmail, Yahoo, Orange) generating the most traffic. The Recipients domain report is for specific use cases – it allows you to manually add and track specific domains (e.g., your key business partners’ domains), regardless of your sending volume to them.
Yes. The Analytics module acts as an early warning system – the Bounce Report instantly flags negative trends and sudden spikes in errors (e.g., an increase in Spambounces). Knowing when and where the problem occurred, you can switch to the standard Email Reports to check the specific error code and server response for that particular message.
Yes. Email API Analytics aggregates data from all sending channels connected to your EmailLabs account – both those using the RESTful API and traditional Cloud SMTP.
Analytics is an add-on module. Contact your Account Manager or our Sales Team to enable this feature. We will help you select the appropriate plan and turn on the reports on your account.
Thanks to monitoring delivery status volumes and trends (for example, a sudden spike in the Spambounce category), you can quickly detect when your messages start being blocked by spam filters. The analytics layer highlights abnormal deviations across specific recipient domains, signaling the need for deeper root-cause analysis in logs and the implementation of corrective actions.
Yes. Visualizing sends on an hourly basis allows you to spot the moment a provider (e.g., Gmail) starts “throttling” your traffic. This manifests as a sudden increase in Softbounces (temporary 4xx errors), despite sending valid messages. This is a clear signal to adjust your sending speed (throughput) to avoid a complete block.
In addition to delivery statuses, the module processes recipient behavior data, including Open Rate and CTR (Click-Through Rate). You can analyze these by domain (e.g., “are Outlook users opening my emails?”), which is key for assessing the quality of your contact database.